Another Form of the Equation for a Linear Relation
Use the graphs to answer questions 1-5
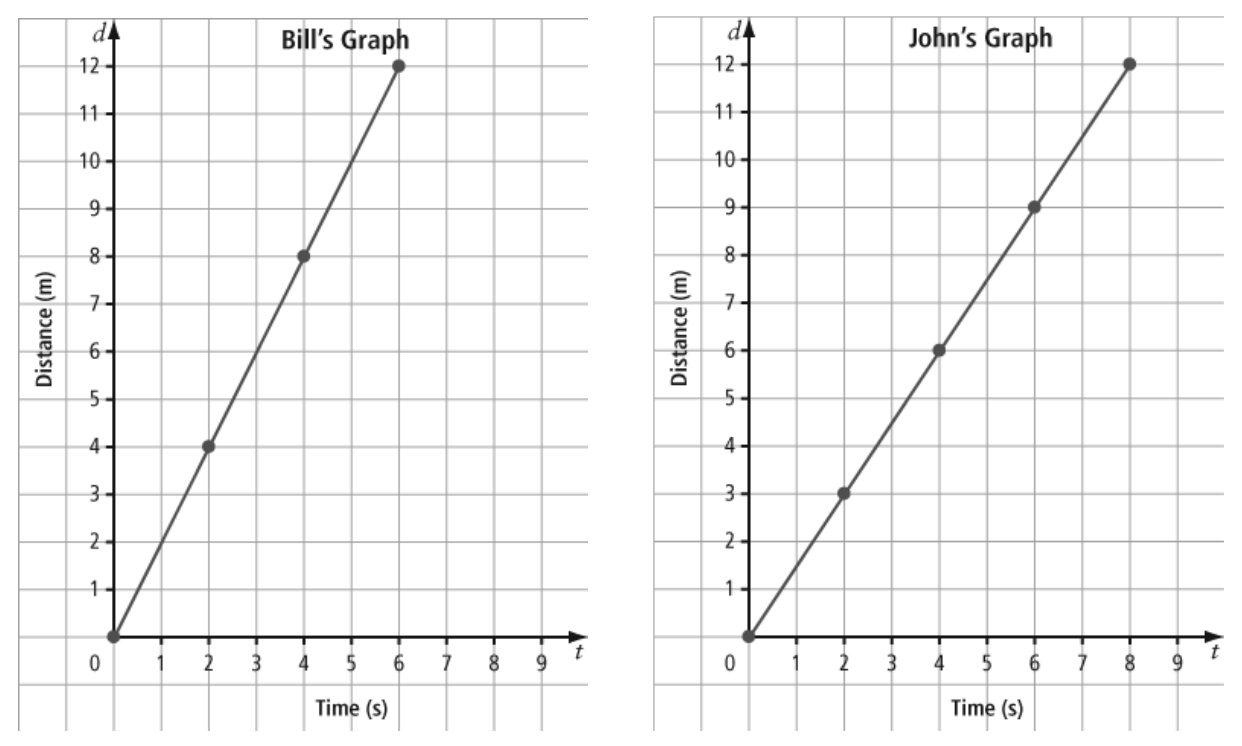
1. Who walked at a faster rate?
2. Who walked farther in the first 4 s and by how much?
3. Which linear relation represents John's graph?
4. Which linear relation represent Bill's graph?
5. At what time has Bill walked 3 m further than John??
Use the figures to answer question 6-7
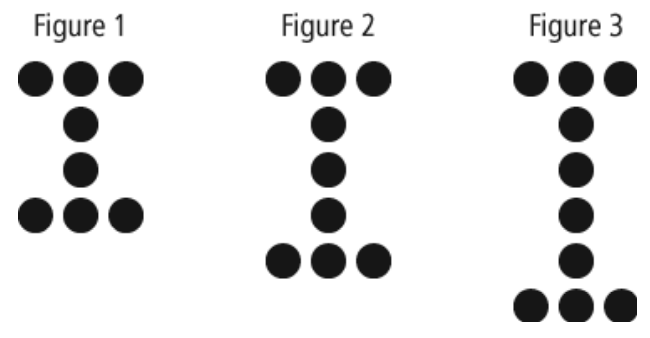
6. Following the pattern above, how many dots will Figure 5 contain?
7. Which equation represents the relationship between the figure number (f) and the number of dots (n) in the figure?
8. Which graph represents the equation Y = -x + 6
9. Which graph represents the equation Y = X
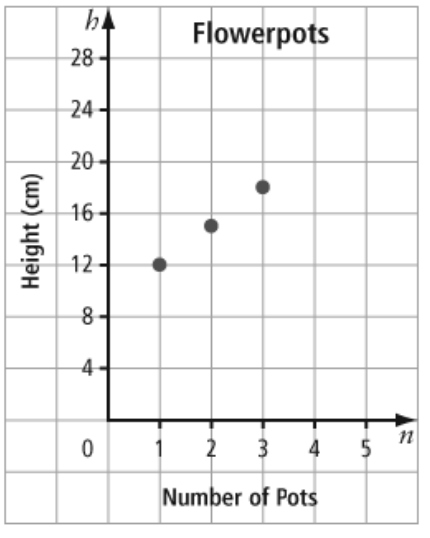
10. As flowepots are added individually to a stack, the height of the new stack is represented by the following graph. What is the height of a stack of 4 flowerpots?
11. For the equation 10x+5y=40, determine the x-intercept
12. 10x+5y=40, determine the y-intercept
13. Which points lie on the graph represented by the equation y=12-5x? P(1, 7), Q(2, 14), R(2, 2), S(0, 7)
14. Describe the graph of the equation x+8=0.
15. A phone company charges a fixed cost of $2.35 per month, plus $0.53 per minute for local calls and $1.07 per minute for long distance calls. Determine the phone bill for a month in which 53 min of local calls and 31 min of long distance calls were made.